
This post is the first in the A Node.JS Holiday Season series from the
Identity team at Mozilla, who last month delivered the first beta
release of Persona. To make Persona, we built a collection tools addressing areas ranging from debugging, to localization, to dependency management, and more. This series of posts will share our learnings and tools with the community, tools which are relevant to anyone building a high availability service with Node.JS. We hope you enjoy the series, and look forward to your thoughts and contributions.We’ll start off with a topic about a nitty-gritty Node.js problem: memory leaks. We present node-memwatch – a library to help discover and isolate memory leaks in Node.
Why Bother?
A fair question to ask about tracking down memory leaks is “Why bother?”. Aren’t there always more pressing problems that need to be tackled first? Why not just restart your service from time to time, or throw more RAM at it? In answer to these questions, we would suggest three things:
- You may not be worried about your increasing memory footprint, but V8 is. (V8 is the engine that Node runs on.) As leaks grow, V8 becomes increasingly aggressive about garbage collection, slowing your app down. So in Node, memory leaks hurt performance.
- Leaks can trigger other types of failure. Leaky code can hang on to references to limited resources. You may run out of file descriptors; you may suddenly be unable to open new database connections. Problems of this sort may emerge long before your app runs out of memory and still leave you dead in the water.
- Finally, sooner or later, your app will crash. And you can bet it will happen right at the moment when you’re getting popular. And then everybody will laugh and say mean things about you on Hacker News and you’ll be sad.
Where’s That Dripping Sound Coming From?
In the plumbing of a complex app, there are various places where leaks can occur. Closures are probably the most well-known and notorious. Because closures maintain references to things in their scope, they are common sources for leaks.
Closure leaks will probably be spotted eventually if somebody’s looking for them, but in Node’s asynchronous world we generate closures all the time in the form of callbacks. If these callbacks are not handled as fast as they are created, memory allocations will build up and code that doesn’t look leaky will act leaky. That’s harder to spot.
Your application could also leak due to a bug in upstream code. You may be able to track down the location in your code from where the leak is emanating, but you might just stare in bewilderment at your perfectly-written code wondering how in the world it can be leaking!
It’s these hard-to-spot leaks that make us want a tool like node-memwatch. Legend has it that months ago, our Lloyd Hilaiel locked himself in a closet for two days, trying to track down a memory leak that became noticeable under heavy load testing. (BTW, look forward to Lloyd’s forthcoming post on load testing.)
After two days of bisecting, he discovered that the culprit was in the Node core: Event listeners in http.ClientRequest were not getting cleaned up. (When this was eventually fixed in Node, the patch consisted of a subtle but crucial two characters.) It was this miserable experience that made Lloyd want to write a tool to help find leaks.
Tools for Finding Leaks
There is already a good and continually growing collection of good tools for finding leaks in Node.js applications. Here are some of them:
- Jimb Esser’s node-mtrace, which uses the
GCCmtraceutility to profile heap usage. - Dave Pacheco’s node-heap-dump takes a snapshot of the V8 heap and serializes the whole thing out in a huge JSON file. It includes tools to traverse and investigate
the resulting snapshot in JavaScript. - Danny Coates’s v8-profiler and node-inspector provide Node bindings for the V8 profiler and a Node debugging interface using the WebKit Web Inspector.
- Felix Gnass’s fork of the same that un-disables the retainers graph
- Felix Geisendörfer’s Node Memory Leak Tutorial is a short and sweet explanation of how to use the
v8-profilerandnode-debugger, and is presently the state-of-the-art for most Node.js memory leak debugging. - Joyent’s SmartOS platform, which furnishes an arsenal of tools at your disposal for debugging Node.js memory leaks
We like all of these tools, but none was a perfect fit for our environment. The Web Inspector approach is fantastic for applications in development, but is difficult to use on a live deployment, especially when multiple servers and subprocess are involved in the mix. As such, it may be difficult to reproduce memory leaks that bite in long-running and heavily-loaded production environments. Tools like dtrace and libumem are truly awe-inspiring, but don’t work on all operating systems.
Enter node-memwatch
We wanted a platform-independent debugging library requiring no instrumentation to tell us when our programs might be leaking memory, and help us find where they are leaking. So we wrote node-memwatch.
It gives you three things:
-
A
'leak'event emittermemwatch.on('leak', function(info) { // look at info to find out about what might be leaking }); -
A
'stats'event emittervar memwatch = require('memwatch'); memwatch.on('stats', function(stats) { // do something with post-gc memory usage stats }); -
A heap diff class
var hd = new memwatch.HeapDiff();
// your code here ...
var diff = hd.end();
-
And there is also a function to trigger garbage collection which can be
useful in testing. Ok, four things.var stats = memwatch.gc();
memwatch.on('stats', ...): Post-GC Heap Statistics
node-memwatch can emit a sample of memory usage directly after a full garbage collection and memory compaction, before any new JS objects have been allocated. (It uses V8’s post-gc hook, V8::AddGCEpilogueCallback, to gather heap usage statistics every time GC occurs.)
The stats data includes:
usage_trendcurrent_baseestimated_basenum_full_gcnum_inc_gcheap_compactionsminmax
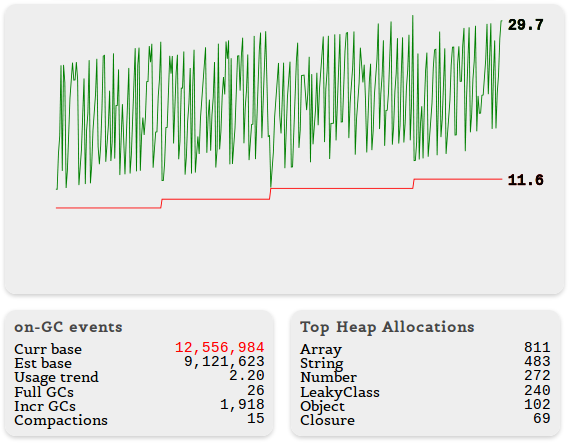
Here’s an example that shows how this data looks over time with a leaky application. The graph below is tracking memory usage over time. The green crazy line shows what process.memoryUsage() reports, and the red line shows the current_base reported by node_memwatch. The box on the lower-left shows additional statistics.

Note that the number of incremental GCs is very high. This is a warning sign that V8 is working overtime to try to clean up allocations.
memwatch.on('leak', ...): Heap Allocation Trends
We have a simple heuristic to warn you that your app may be leaky. If, over five consecutive GCs, you continue to allocate memory without releasing it, node-memwatch will emit a leak event. The message tells you in nice, human-readable form what’s going on:
{ start: Fri, 29 Jun 2012 14:12:13 GMT,
  end: Fri, 29 Jun 2012 14:12:33 GMT,
  growth: 67984,
  reason: 'heap growth over 5 consecutive GCs (20s) - 11.67 mb/hr' }
memwatch.HeapDiff(): Finding Leaks
Finally, node-memwatch can compare snapshots of object names and allocation counts on the heap. The resulting diff can help isolate offenders.
var hd = new memwatch.HeapDiff();

// Your code here ...

var diff = hd.end();
The contents of diff will look something like this:
{
  "before": {
    "nodes": 11625,
    "size_bytes": 1869904,
    "size": "1.78 mb"
  },
  "after": {
    "nodes": 21435,
    "size_bytes": 2119136,
    "size": "2.02 mb"
  },
  "change": {
    "size_bytes": 249232,
    "size": "243.39 kb",
    "freed_nodes": 197,
    "allocated_nodes": 10007,
    "details": [
      {
        "what": "Array",
        "size_bytes": 66688,
        "size": "65.13 kb",
        "+": 4,
        "-": 78
      },
      {
        "what": "Code",
        "size_bytes": -55296,
        "size": "-54 kb",
        "+": 1,
        "-": 57
      },
      {
        "what": "LeakingClass",
        "size_bytes": 239952,
        "size": "234.33 kb",
        "+": 9998,
        "-": 0
      },
      {
        "what": "String",
        "size_bytes": -2120,
        "size": "-2.07 kb",
        "+": 3,
        "-": 62
      }
    ]
  }
}
HeapDiff triggers a full GC before taking its samples, so the data won’t be full of a lot of junk. memwatch‘s event emitters will not notify of HeapDiff GC events, so you can safely put HeapDiff calls in your 'stats' handler.
In the graph below, we’ve added the objects with the most heap allocations:
Where to Go From Here
node-memwatch provides:
- Accurate memory usage tracking
- Notifications about probable leaks
- A means to produce a heap diff
- That is cross-platform
- And that does not require any extra instrumentation
We want it to do more. In particular, we want node-memwatch to be able to provide some examples of a leaked object (e.g., names of variables, array indices, or closure code).
We hope you’ll find node-memwatch useful in debugging leaks in your Node app, and that you’ll fork the code and help us make it better.
19 comments